Top 100 Universities Worldwide by Highly Cited Research
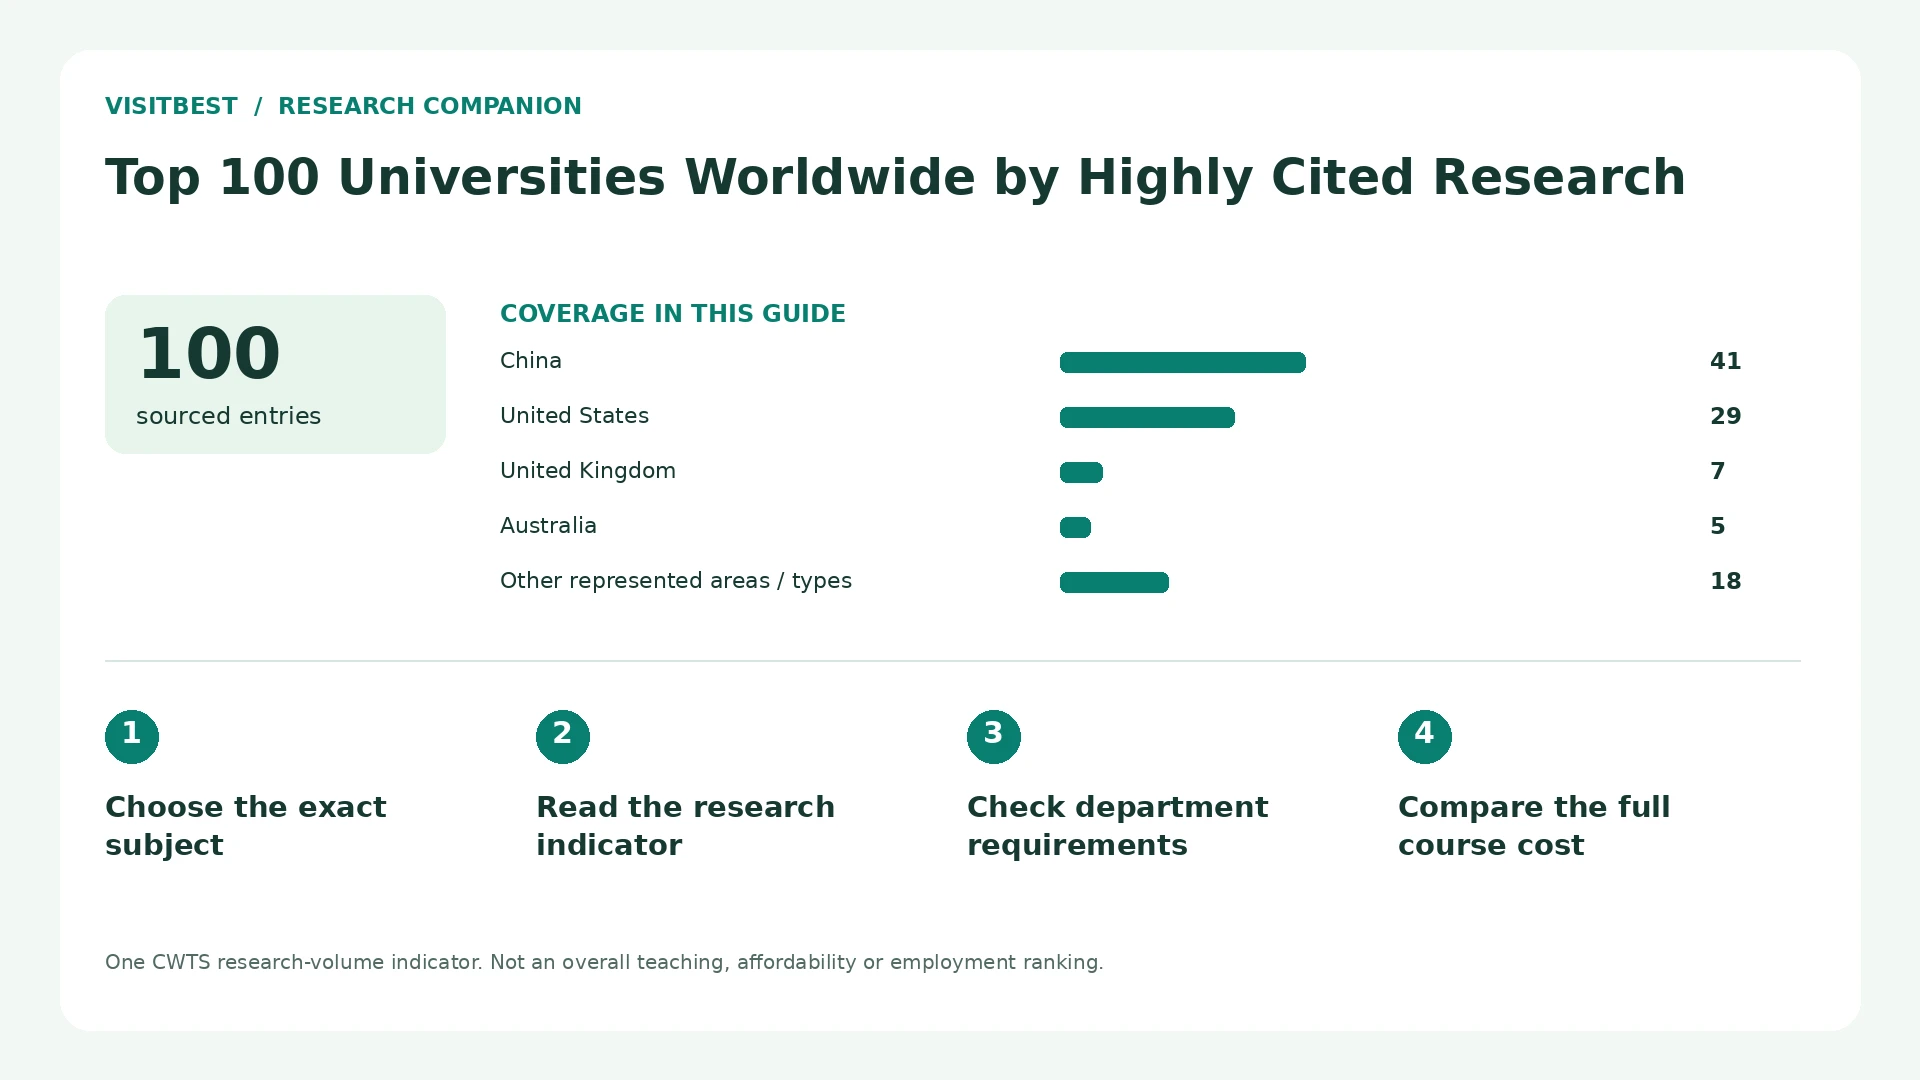
One CWTS research-volume indicator. Not an overall teaching, affordability or employment ranking.
A university can produce influential research and still be the wrong place for a particular degree. This guide gives students a reproducible research shortlist. It uses CWTS Leiden Ranking Open Edition 2025 with 2020–2023 publications. The table orders institutions by the fractional volume of papers among the most cited 10% in their field and year. The indicator is P(top 10%). Students can use that signal alongside the exact department, course and funding offer. The research period is visible so the guide date does not imply new 2026 research results.

The complete 100-entry table
100 of 100 entries shown
| No. | Institution and source | Location | Type / status | Recorded information |
|---|---|---|---|---|
| 1 | Harvard University | United States | University | P=40475; P(top 10%)=7770; PP(top 10%)=19.2% |
| 2 | Zhejiang University | China | University | P=35974; P(top 10%)=5384; PP(top 10%)=15.0% |
| 3 | Shanghai Jiao Tong University | China | University | P=38913; P(top 10%)=5312; PP(top 10%)=13.7% |
| 4 | Tsinghua University | China | University | P=27466; P(top 10%)=4700; PP(top 10%)=17.1% |
| 5 | Sichuan University | China | University | P=34717; P(top 10%)=4679; PP(top 10%)=13.5% |
| 6 | Central South University | China | University | P=31557; P(top 10%)=4442; PP(top 10%)=14.1% |
| 7 | Huazhong University of Science and Technology | China | University | P=28450; P(top 10%)=4372; PP(top 10%)=15.4% |
| 8 | Stanford University | United States | University | P=21098; P(top 10%)=4195; PP(top 10%)=19.9% |
| 9 | Sun Yat-sen University | China | University | P=30371; P(top 10%)=4088; PP(top 10%)=13.5% |
| 10 | Peking University | China | University | P=27880; P(top 10%)=3980; PP(top 10%)=14.3% |
| 11 | University of Toronto | Canada | University | P=28575; P(top 10%)=3751; PP(top 10%)=13.1% |
| 12 | University College London | United Kingdom | University | P=22410; P(top 10%)=3618; PP(top 10%)=16.1% |
| 13 | Wuhan University | China | University | P=22809; P(top 10%)=3520; PP(top 10%)=15.4% |
| 14 | University of Oxford | United Kingdom | University | P=19249; P(top 10%)=3498; PP(top 10%)=18.2% |
| 15 | University of the Chinese Academy of Sciences | China | University | P=23589; P(top 10%)=3292; PP(top 10%)=14.0% |
| 16 | Harbin Institute of Technology | China | University | P=23440; P(top 10%)=3291; PP(top 10%)=14.0% |
| 17 | Johns Hopkins University | United States | University | P=22714; P(top 10%)=3266; PP(top 10%)=14.4% |
| 18 | Xi'an Jiaotong University | China | University | P=24690; P(top 10%)=3265; PP(top 10%)=13.2% |
| 19 | University of Science and Technology of China | China | University | P=21767; P(top 10%)=3248; PP(top 10%)=14.9% |
| 20 | University of Michigan | United States | University | P=22684; P(top 10%)=3217; PP(top 10%)=14.2% |
| 21 | University of Pennsylvania | United States | University | P=19862; P(top 10%)=2995; PP(top 10%)=15.1% |
| 22 | National University of Singapore | Singapore | University | P=17157; P(top 10%)=2972; PP(top 10%)=17.3% |
| 23 | University of Cambridge | United Kingdom | University | P=16246; P(top 10%)=2916; PP(top 10%)=17.9% |
| 24 | Fudan University | China | University | P=21327; P(top 10%)=2897; PP(top 10%)=13.6% |
| 25 | Tianjin University | China | University | P=19893; P(top 10%)=2788; PP(top 10%)=14.0% |
| 26 | Imperial College London | United Kingdom | University | P=15419; P(top 10%)=2738; PP(top 10%)=17.8% |
| 27 | Cornell University | United States | University | P=16835; P(top 10%)=2632; PP(top 10%)=15.6% |
| 28 | Tongji University | China | University | P=18626; P(top 10%)=2630; PP(top 10%)=14.1% |
| 29 | Shandong University | China | University | P=20560; P(top 10%)=2583; PP(top 10%)=12.6% |
| 30 | Jilin University | China | University | P=20753; P(top 10%)=2545; PP(top 10%)=12.3% |
| 31 | Yale University | United States | University | P=14940; P(top 10%)=2484; PP(top 10%)=16.6% |
| 32 | Columbia University | United States | University | P=15326; P(top 10%)=2463; PP(top 10%)=16.1% |
| 33 | Southeast University | China | University | P=19013; P(top 10%)=2449; PP(top 10%)=12.9% |
| 34 | Chongqing University | China | University | P=16321; P(top 10%)=2446; PP(top 10%)=15.0% |
| 35 | University of California, San Diego | United States | University | P=15194; P(top 10%)=2409; PP(top 10%)=15.9% |
| 36 | University of Washington, Seattle | United States | University | P=16967; P(top 10%)=2402; PP(top 10%)=14.2% |
| 37 | Massachusetts Institute of Technology | United States | University | P=10278; P(top 10%)=2378; PP(top 10%)=23.1% |
| 38 | Northwestern Polytechnical University | China | University | P=16054; P(top 10%)=2378; PP(top 10%)=14.8% |
| 39 | Monash University | Australia | University | P=16635; P(top 10%)=2369; PP(top 10%)=14.2% |
| 40 | University of California, Los Angeles | United States | University | P=15397; P(top 10%)=2366; PP(top 10%)=15.4% |
| 41 | University of Hong Kong | China | University | P=14057; P(top 10%)=2334; PP(top 10%)=16.6% |
| 42 | University of Sydney | Australia | University | P=17327; P(top 10%)=2301; PP(top 10%)=13.3% |
| 43 | University of Melbourne | Australia | University | P=17336; P(top 10%)=2295; PP(top 10%)=13.2% |
| 44 | Zhengzhou University | China | University | P=17867; P(top 10%)=2286; PP(top 10%)=12.8% |
| 45 | South China University of Technology | China | University | P=16192; P(top 10%)=2252; PP(top 10%)=13.9% |
| 46 | Beijing Institute of Technology | China | University | P=15553; P(top 10%)=2214; PP(top 10%)=14.2% |
| 47 | Nanyang Technological University | Singapore | University | P=11328; P(top 10%)=2144; PP(top 10%)=18.9% |
| 48 | Chinese Academy of Medical Sciences & Peking Union Medical College | China | University | P=18514; P(top 10%)=2133; PP(top 10%)=11.5% |
| 49 | University of British Columbia | Canada | University | P=16653; P(top 10%)=2126; PP(top 10%)=12.8% |
| 50 | University of New South Wales | Australia | University | P=14180; P(top 10%)=2116; PP(top 10%)=14.9% |
| 51 | University of Copenhagen | Denmark | University | P=16518; P(top 10%)=2072; PP(top 10%)=12.5% |
| 52 | Hunan University | China | University | P=11405; P(top 10%)=2068; PP(top 10%)=18.1% |
| 53 | New York University | United States | University | P=13497; P(top 10%)=2052; PP(top 10%)=15.2% |
| 54 | University of California, San Francisco | United States | University | P=12094; P(top 10%)=2047; PP(top 10%)=16.9% |
| 55 | Hong Kong Polytechnic University | China | University | P=10819; P(top 10%)=2037; PP(top 10%)=18.8% |
| 56 | ETH Zürich | Switzerland | University | P=10983; P(top 10%)=2024; PP(top 10%)=18.4% |
| 57 | Duke University | United States | University | P=14426; P(top 10%)=2016; PP(top 10%)=14.0% |
| 58 | University of Electronic Science and Technology of China | China | University | P=13934; P(top 10%)=2008; PP(top 10%)=14.4% |
| 59 | University of Queensland | Australia | University | P=14579; P(top 10%)=1997; PP(top 10%)=13.7% |
| 60 | University of California, Berkeley | United States | University | P=10329; P(top 10%)=1989; PP(top 10%)=19.3% |
| 61 | Northwestern University | United States | University | P=12716; P(top 10%)=1985; PP(top 10%)=15.6% |
| 62 | Katholieke Universiteit Leuven | Belgium | University | P=14812; P(top 10%)=1978; PP(top 10%)=13.4% |
| 63 | Beihang University | China | University | P=14504; P(top 10%)=1965; PP(top 10%)=13.5% |
| 64 | Seoul National University | South Korea | University | P=20187; P(top 10%)=1906; PP(top 10%)=9.4% |
| 65 | Ohio State University | United States | University | P=16712; P(top 10%)=1879; PP(top 10%)=11.2% |
| 66 | University of Chicago | United States | University | P=12238; P(top 10%)=1878; PP(top 10%)=15.3% |
| 67 | Nanjing University | China | University | P=13426; P(top 10%)=1859; PP(top 10%)=13.8% |
| 68 | Dalian University of Technology | China | University | P=14469; P(top 10%)=1856; PP(top 10%)=12.8% |
| 69 | King's College London | United Kingdom | University | P=11999; P(top 10%)=1841; PP(top 10%)=15.3% |
| 70 | McGill University | Canada | University | P=13947; P(top 10%)=1804; PP(top 10%)=12.9% |
| 71 | Utrecht University | Netherlands | University | P=11562; P(top 10%)=1793; PP(top 10%)=15.5% |
| 72 | Pennsylvania State University | United States | University | P=15922; P(top 10%)=1773; PP(top 10%)=11.1% |
| 73 | Northeastern University, China | China | University | P=13651; P(top 10%)=1766; PP(top 10%)=12.9% |
| 74 | University of Pittsburgh | United States | University | P=14568; P(top 10%)=1763; PP(top 10%)=12.1% |
| 75 | University of Wisconsin, Madison | United States | University | P=14412; P(top 10%)=1746; PP(top 10%)=12.1% |
| 76 | Shenzhen University | China | University | P=11236; P(top 10%)=1736; PP(top 10%)=15.5% |
| 77 | Soochow University | China | University | P=14834; P(top 10%)=1730; PP(top 10%)=11.7% |
| 78 | University of Science and Technology Beijing | China | University | P=12327; P(top 10%)=1711; PP(top 10%)=13.9% |
| 79 | Jiangsu University | China | University | P=12976; P(top 10%)=1700; PP(top 10%)=13.1% |
| 80 | China Agricultural University | China | University | P=10069; P(top 10%)=1698; PP(top 10%)=16.9% |
| 81 | University of Texas Health Science Center at Houston | United States | University | P=11376; P(top 10%)=1670; PP(top 10%)=14.7% |
| 82 | Washington University in St. Louis | United States | University | P=10158; P(top 10%)=1662; PP(top 10%)=16.4% |
| 83 | University of Florida | United States | University | P=16093; P(top 10%)=1653; PP(top 10%)=10.3% |
| 84 | Nankai University | China | University | P=10389; P(top 10%)=1644; PP(top 10%)=15.8% |
| 85 | University of Minnesota, Twin Cities | United States | University | P=13949; P(top 10%)=1638; PP(top 10%)=11.7% |
| 86 | The University of Manchester | United Kingdom | University | P=11746; P(top 10%)=1632; PP(top 10%)=13.9% |
| 87 | Université de Paris-Cité (EPE) | France | University | P=12286; P(top 10%)=1632; PP(top 10%)=13.3% |
| 88 | The Chinese University of Hong Kong | China | University | P=9983; P(top 10%)=1626; PP(top 10%)=16.3% |
| 89 | The University of Edinburgh | United Kingdom | University | P=10977; P(top 10%)=1614; PP(top 10%)=14.7% |
| 90 | Case Western Reserve University | United States | University | P=13983; P(top 10%)=1591; PP(top 10%)=11.4% |
| 91 | University of Zurich | Switzerland | University | P=10862; P(top 10%)=1585; PP(top 10%)=14.6% |
| 92 | University of North Carolina, Chapel Hill | United States | University | P=12256; P(top 10%)=1577; PP(top 10%)=12.9% |
| 93 | University of Groningen | Netherlands | University | P=10821; P(top 10%)=1558; PP(top 10%)=14.4% |
| 94 | Sapienza University of Rome | Italy | University | P=13937; P(top 10%)=1551; PP(top 10%)=11.1% |
| 95 | The University of Tokyo | Japan | University | P=18568; P(top 10%)=1547; PP(top 10%)=8.3% |
| 96 | Xiamen University | China | University | P=12251; P(top 10%)=1546; PP(top 10%)=12.6% |
| 97 | University of Alberta | Canada | University | P=14064; P(top 10%)=1528; PP(top 10%)=10.9% |
| 98 | Ghent University | Belgium | University | P=12466; P(top 10%)=1523; PP(top 10%)=12.2% |
| 99 | University of California, Davis | United States | University | P=11926; P(top 10%)=1520; PP(top 10%)=12.7% |
| 100 | King Saud University | Saudi Arabia | University | P=14159; P(top 10%)=1517; PP(top 10%)=10.7% |
List numbers are navigation identifiers except where the stated research/completion ordering or published NIRF rank is explained. Download the complete CSV.
Sources and selection method
All sciences; world; 2020–2023; fractional counting; core publications only; minimum P=1000; descending P(top 10%).
One research-volume measure. No teaching, fees, employment or overall university rank.
Source: CWTS Leiden Ranking Open Edition 2025. Source records checked 2026-10-01. Current admissions, courses and fees require the institution’s own current evidence. Each row links to its source.
What the research measure means
P is the number of publications under the selected counting method. P(top 10%) is the number in the most cited tenth after field and year normalization. PP(top 10%) is the proportion of an institution’s publications in that group. Volume and share answer different questions. A larger institution can lead in volume while another has a higher share. Fractional counting divides credit for collaborative papers. The minimum publication threshold is 1,000. The filter uses all sciences and core publications. A change to the field, threshold or ordering indicator changes the list.
Compare the department and qualification
Students need the exact award and subject before comparing universities. Institution-wide research can hide differences between departments. The official course catalogue explains compulsory modules, assessment and prerequisites. Research applicants can read a prospective supervisor’s recent work and ask about available supervision. Taught-course applicants can compare practical facilities, contact hours and academic help. A research position does not establish entry eligibility or guarantee an internship. The department’s current requirements carry more weight for that application.
Calculate the complete study cost
The current fee schedule needs the applicant category and academic year. A useful budget includes housing, meals, health cover, equipment and travel. An award that covers tuition can still leave a living-cost gap. Students need to separate a confirmed award from a scholarship they hope to receive. Deposits, refunds and renewal conditions belong in the comparison sheet. The original quoted currency stays visible. A professional qualification also needs recognition checks in the country where the graduate plans to work.
Use a small evidence-based shortlist
The table can be reduced by subject, teaching language and financial feasibility. Each shortlisted course needs a current official URL, entry conditions, total cost and unanswered questions. Students can ask who teaches first-year modules and how help is arranged when progress slows. Outcome claims need the cohort year and reporting definition. A clear funding offer or a strong subject fit can matter more than a small research-rank difference. The final choice needs an affordable course that the applicant can actually enter.
Decision checklist
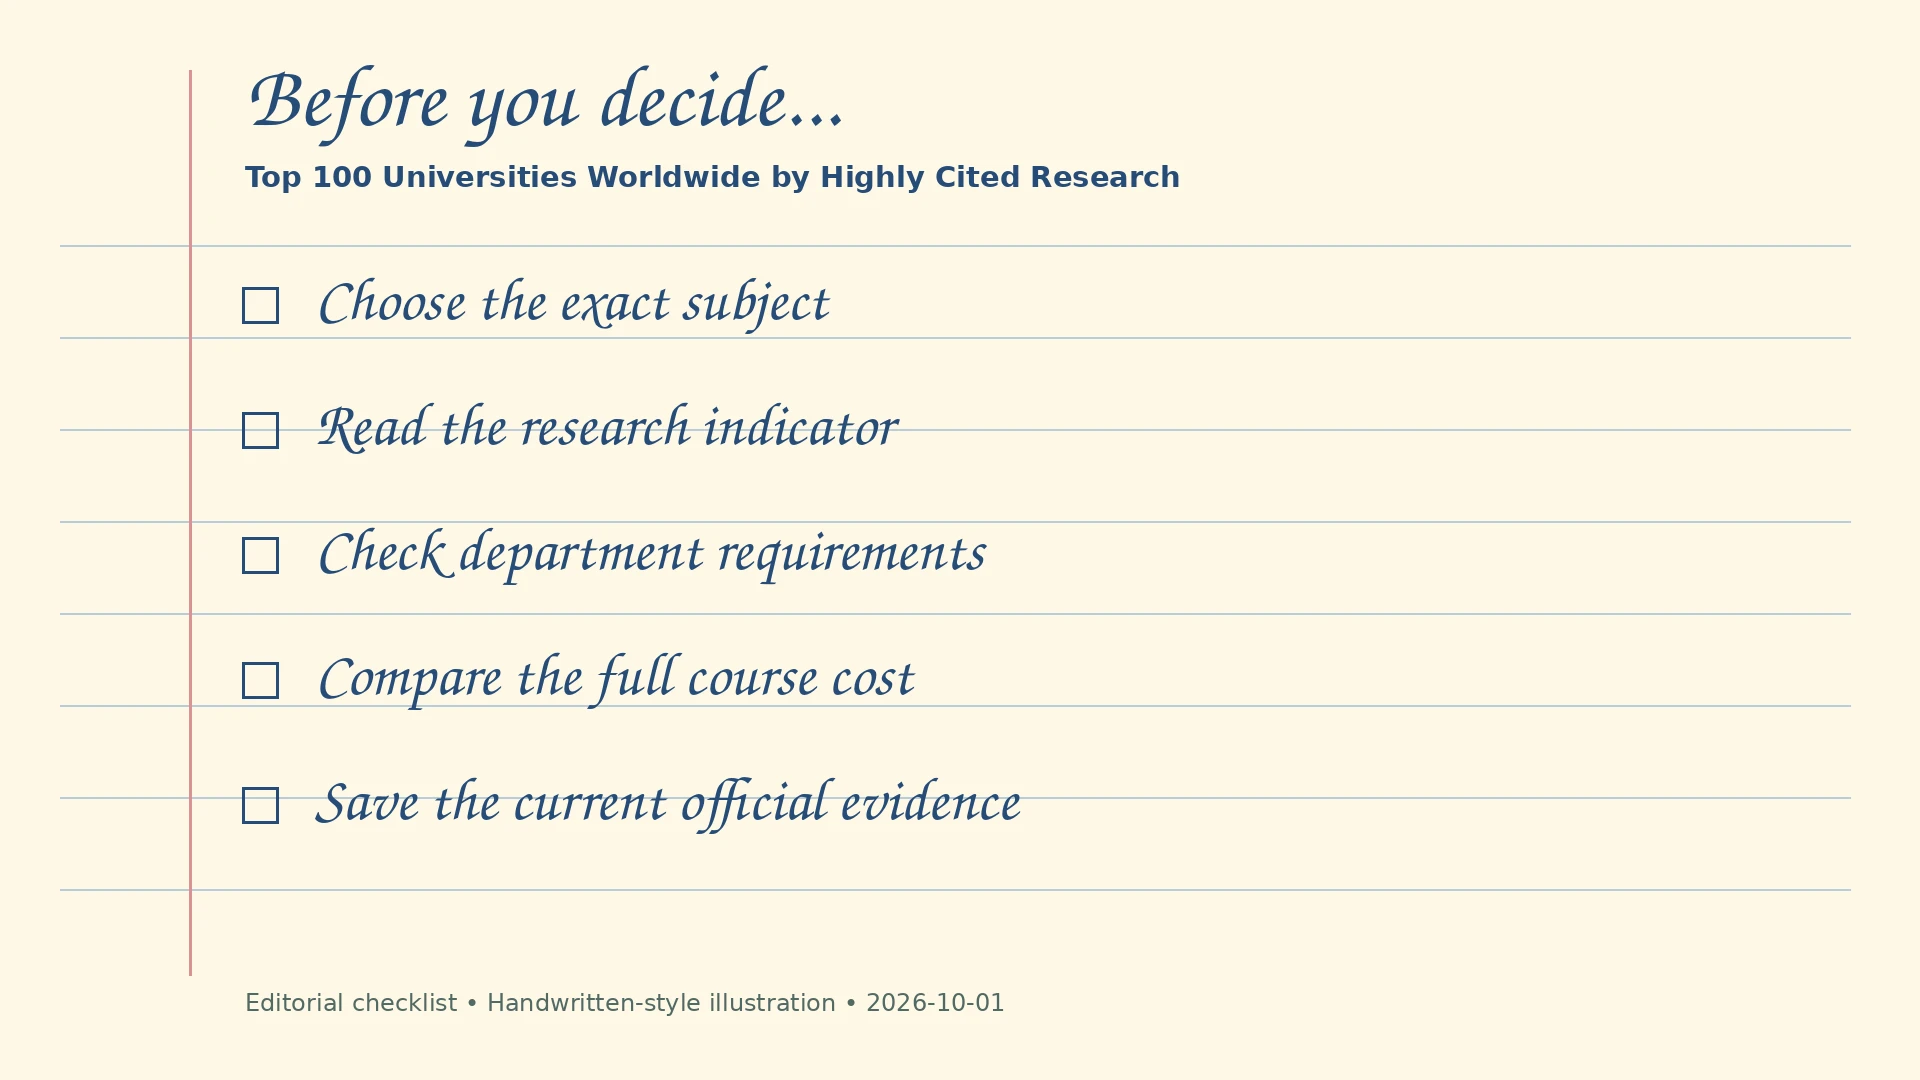
- Choose the exact subject
- Read the research indicator
- Check department requirements
- Compare the full course cost
- Save the current official evidence
Shortlist worksheet
For three feasible options, record the exact programme or year group, current eligibility, full cost, support provision, travel and the official evidence date. Leave a missing answer unresolved instead of estimating it.
Questions before you decide
Is this an overall world ranking?
No. It ranks one stated CWTS research-volume indicator. Teaching and student outcomes are separate measures.
What period does the table cover?
The 2025 edition uses 2020–2023 publications. The research-check date does not change that period.
Are fees and deadlines universal?
No. They depend on the exact course, intake and applicant category. Use the official course pages.
Does a high research rank guarantee a place?
No. The applicant still needs the course’s published qualifications and admission process.
How is the order reproduced?
Use the methodology settings supplied with the CSV and sort by P(top 10%) descending.
Related guides
- Top 100 Universities in Europe by Highly Cited Research
- Top 100 Large US Finance Programs: Data and Admissions Guide
Compiled by VisitBest from the stated public sources. Current course, admission, service and price details should be obtained from the relevant provider. Send corrections with the exact record and a supporting source.